HEAT MAP – NEW WIDGET
January 9, 2023
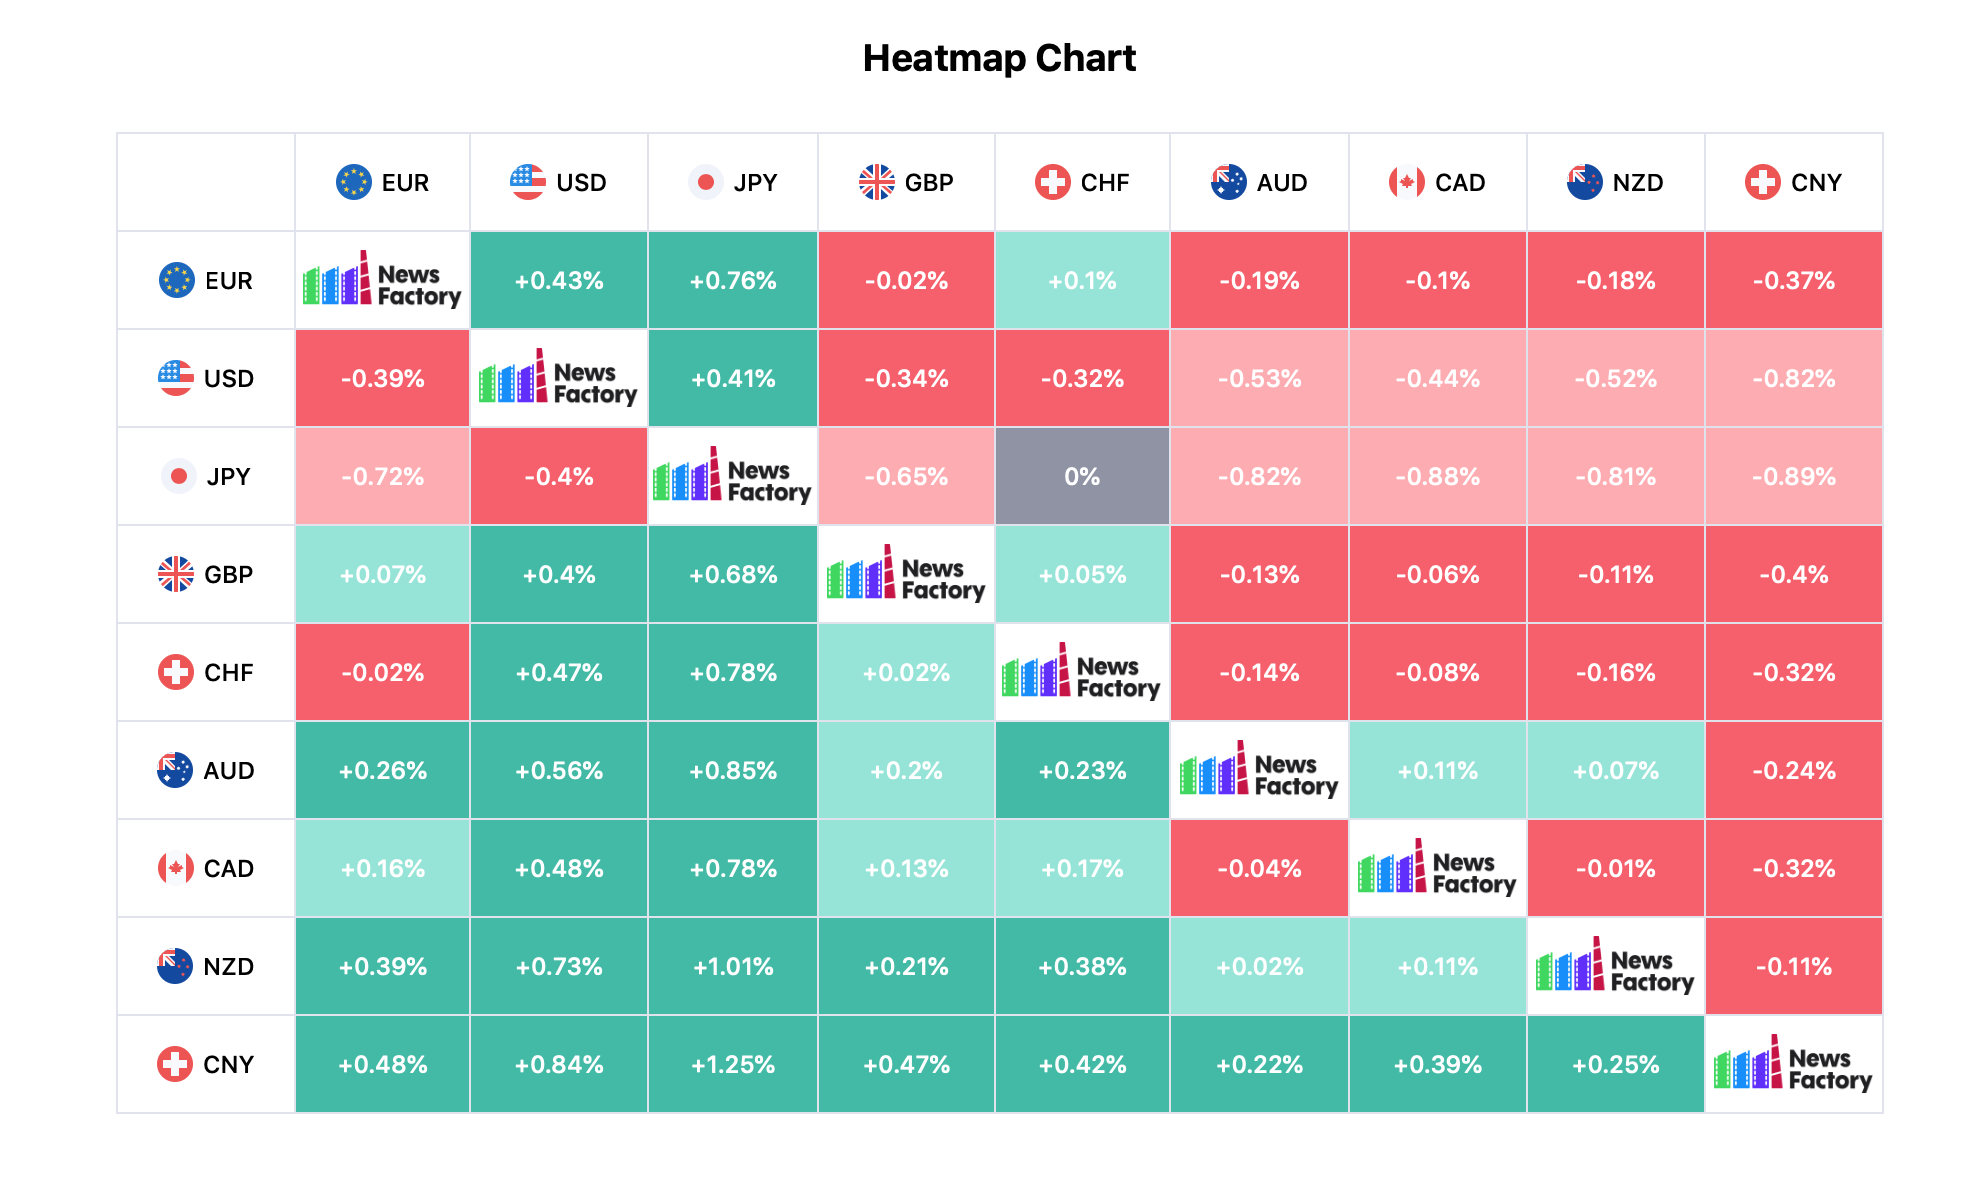
A heat map is a type of data visualisation that displays a phenomenon’s colour-coded magnitude in two dimensions. The reader will receive clear visual clues about how the occurrence is clustered or fluctuates over space from the fluctuation in color, which may be by hue or intensity. The heat-map can be used to locate liquidity in the market and monitor liquidity providers’ actions. In other words, it aids traders in identifying the locations of the actual market orders.
How should I use a heat map? It’s quite simple. Anyone can select their chosen currencies to be shown on the map, and for a more individualised experience, the customer or broker can choose to have their logo shown on the heat map.
Our heat map comes for free for our subscriptions buyers only!
For more information kindly email janet@newsfactory.tv